So you want to create an interactive map? And why wouldn’t you? Interactive maps are a great way to share your data in a meaningful way.
In this article, we will look at how to create an interactive map using Maptive’s mapping software.
Maptive is powered by Google Maps and can take up to 100,000 addresses and transform them into an interactive map. From there, you have a number of tools that allow you to view and analyze your data. Furthermore, you can collaborate with others on a map in real-time or make changes to an embedded map without re-uploading it. This is the core of how the Maptive mapping software works. Let’s zoom in and examine its features in detail.
Features of Maptive
- Filtering Tool
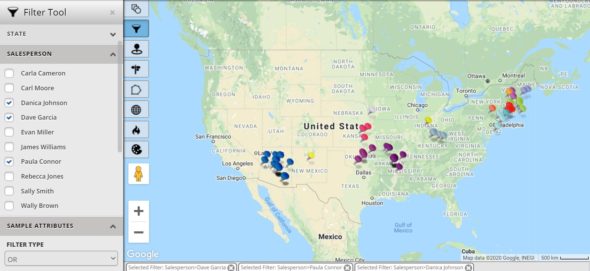
Maptive’s filter tool lets you group and refine your geographic data so you can display different information on your map. The filtering options include categories, number ranges, dates, and more.
- Multi-Stop Route Planner and Optimization Tool
A map will get you where you want to go, but to get there efficiently, it’s best to use a route-planner, especially if you’re planning on making multiple stops. Maptive offers a multi-stop and route optimization tool so you can design the most efficient way to travel. It allows you to plot a course with over 20 locations and up to 70 stops. Additionally, you can drag and drop stops on your route to customize your drive and get turn-by-turn directions.
- Heat Mapping Tool
A heat map allows you to plot the density of your data. In doing so, you get a better understanding of where you have large concentrations of data and where data is sparse. Maptive lets you apply this tool to sales data, customer locations, competitor locations, and other geographic data types.
- Territory Drawing Tool
The territory drawing tool helps you organize your map by creating visual boundaries based on predefined areas such as cities, states, zip codes, territories, districts, etc. You can also create boundary fills to color-code each area depending on the marker density, demographic data, or your own numeric information. This will allow you to analyze the data within your territories or create sales territories so that customers are distributed evenly.
- Demographics/Census Mapping Tool
To strengthen the content of your maps, Maptive employs population data from the U.S. census. This means that in addition to your data, you can also see things like population age, density, race, education, median household income, etc.
- Store Finder Tool
If your business has multiple physical locations, it can help to create a store finder map for your website. This will allow users to view the distance from their current location to your business locations.
Now that we’ve reviewed the tools Maptive offers, let’s look at the process for creating your map.
How to Build an Interactive Map with Maptive
- Create a Maptive Free Trial Account
Although Maptive requires that you purchase a paid subscription, they offer a 10-day free, no-risk trial. To create your free trial account, you will need to go to Maptive.com and click on the Create Your Free Map Now button. This will redirect you to a form. Simply fill out the information requested and click the Create Account button. You will then be sent an activation link by email. Click on this link to access your new account.
- Transfer or Input Your Data
To create your map, you need to click the Create New Map button. A pop-up will appear, prompting you to name and describe your map. Once you’ve done this, click Continue. You will then be prompted to enter a data source. You can either upload your data from an Excel or Google spreadsheet, copy and paste in your data, or enter your data manually.
- View Your Map
Once your data has been uploaded, click Create Map, and your data will transform into an interactive map which you can then analyze using the tools mentioned above.
Conclusion
Creating an interactive map with Maptive is relatively simple. However, it’s not so much the creation of the map that makes Maptive a helpful tool. Instead, it’s Maptive’s many features that allow you to bring your data to life.


